See how livestock populations are changing: updated global Livestock Population Trends dashboard
ILRI
Latest release presents current FAO data across six interactive views
First launched in 2021, the Livestock Populations Trends dashboard has now been updated to include the latest data from the Food and Agriculture Organization of the United Nations (FAO), ensuring users have access to the most current information.
Accurate livestock population data is central to areas of research including economic modelling and forecasting, resource planning, and disease management. This tool offers a visual representation of global livestock populations from 1961 to 2024 by country and region, making the data accessible to the wider livestock research and advocacy community.
Explore the dashboard
Who it's for
This dashboard is designed for policymakers, researchers, and practitioners who need to understand where livestock populations are concentrated and how they are changing, supporting evidence-based planning and resource allocation.
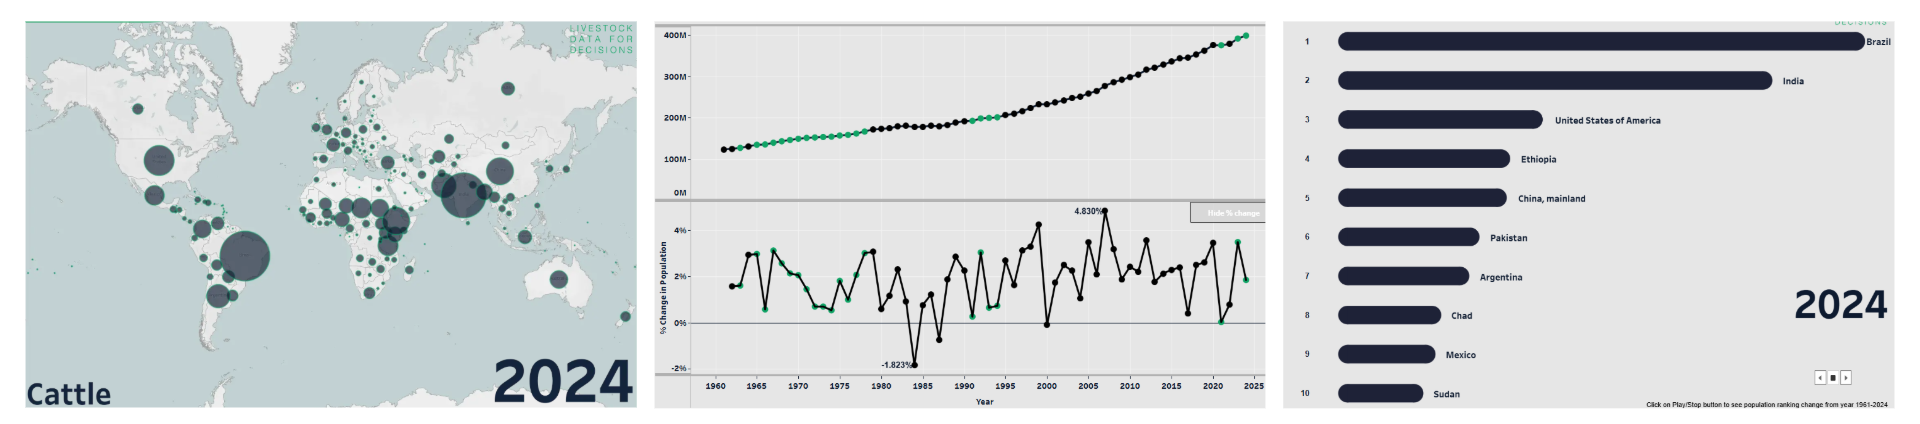
Example data visualisations from the Livestock Population Trends dashboard. Image 1 shows 2024 distribution of cattle populations worldwide; image 2 shows the annual percentage change of the cattle population in Africa from 1962-2024; image 3 shows the top 10 leading countries for cattle in 2024.
What does the dashboard offer?
While static spreadsheets can be informative, data dashboards provide a more user-friendly interface. This dashboard visualisation allows users to filter for specific parameters and quickly visualise livestock population comparisons and trends over time within a country.
The updated dashboard retains the core features that users have found most valuable, organised across six intuitive tabs.
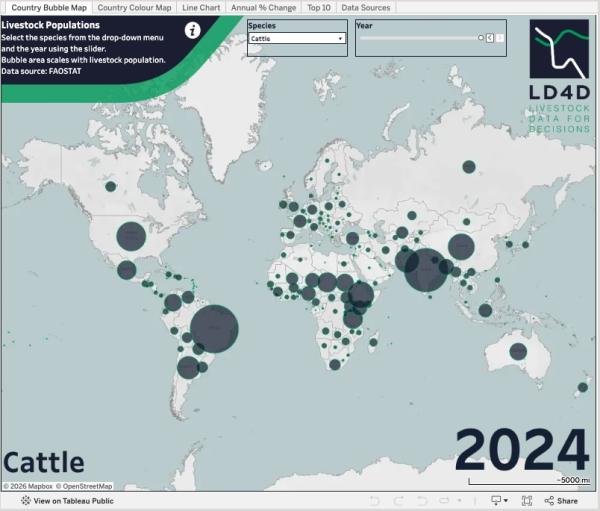
The Country Bubble and Colour Maps provide a global overview, allowing users to see which nations host specific livestock populations and how these distributions shift over time. Bubble areas and shading intensity scale directly with population counts, offering an immediate visual sense of magnitude.
The Line Chart and Annual % Change tabs drill into the trends behind the numbers, enabling users to explore population trajectories within specific countries or regions. These views include critical metadata flags, distinguishing between official figures and estimated values.
The Top 10 tab features an animated bar chart race, illustrating how the leading countries for each species have changed position through the years.
Finally, the Data Sources tab ensures users can interpret findings with context, including notes on methods and data limitations from the data provider.
Behind the data
When compiling and reviewing the data, SEBI-Livestock data analyst Isabell Orlishausen observed notable changes in values and source flags across existing data points – for example, some historical figures have been revised, while others have shifted from official submissions to imputed estimates. These revisions highlight underlying data uncertainty, particularly in low-income regions, and where precise population counts drive critical policy decisions. These variations will be explored further to understand their impact on modelling and decision-making.
“Evidence is only useful if it can be interrogated and understood,” said Isabell. “This update reinforces our commitment to providing findable, accessible, and reusable data tools for the global livestock community. By maintaining this dashboard, we hope to support stronger livestock development strategies across sub-Saharan Africa and beyond."
Tell us what you need
Do you use this dashboard to guide action? Let us know how it fits into your workflow and where improvements could be made. Your insights will help shape the next generation of tools for livestock evidence.