It’s even easier to find the right tool to assess the socio-environmental impacts of food systems

The updated dashboard allows users to navigate and choose from over 90 environmental assessment tools and explore case studies.
By Vanessa Meadu, Agnieszka Czechon, Frances Ryan and Sophie Jenkinson
It’s now easier than ever to find the right tool for measuring the environmental impacts of agricultural systems, including livestock and rice. The dashboard of “Environmental assessment tools for agri-food systems” has been updated and redesigned to help users find the most appropriate tools for their needs based on subject focus, emissions sources, measurement scale and other features. The dashboard serves users across all regions but is tailored for use by decision makers in low-and middle-income countries who wish to measure environmental impacts as a key step towards unlocking climate finance and evaluating projects.
The dashboard was produced by the Livestock Data for Decisions Network (LD4D) in collaboration with the Climate and Clean Air Coalition (CCAC), a UNEP convened initiative.
Gregory Kohler, Agriculture Expert at CCAC, explained:
This dashboard provides countries with a useful compilation of available tools alongside real-world examples of their application. These tools can help identify the right approaches to measure environmental impacts, which is an essential step towards accessing the climate finance needed to reduce emissions from the agriculture sector.
Who it’s for
Tools for making environmental assessments are scattered across different platforms, making it difficult for decision makers to know which tools are available to help them understand the environmental implications of their food systems. The dashboard aims to compile and categorise tools so that decision makers can find what they need and make more informed investments and decisions on issues related to agriculture and climate.
Project managers can find the right tool to understand emissions levels and environmental impacts of their agricultural development projects. This can also benefit project managers who are developing new proposals and want to ensure they use an assessment tool that is tailored to their project goals.
National-level policy makers working in departments for agriculture and livestock can find the best tool to help them understand where the biggest opportunities are for reducing emissions in their country’s livestock sector.
Project funders putting out calls for proposals could encourage applicants to use the dashboard to select the right tool for their context and encourage more coordinated and impactful use of existing tools.
Researchers can access a centralised collection of validated assessment tools and case studies. The dashboard helps researchers identify methodological gaps, compare different approaches, and find practical examples of tool applications, informing new assessment method development and helping them select the most appropriate tools for their research contexts.
Dashboard introduction
What’s new?
The navigator has undergone a thoughtful transformation to enhance both usability and value for its users.
Expanded tool library Over 20 tools have been added to the dashboard, with the entire collection reviewed and updated to reflect the latest developments in environmental assessment.
The updated dashboard now offers additional search categories reaching beyond livestock and environment, including gender and communities, human nutrition, and infrastructure. Users can access an expanded range of tools for calculating the contribution of greenhouse gas (GHG) emissions.
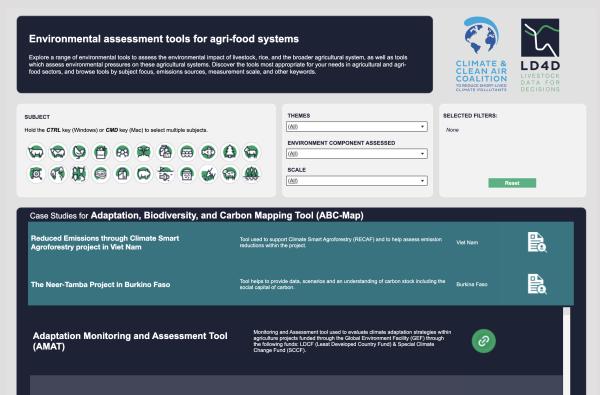
Case Studies One of the most notable improvements is the integration of real-world case studies alongside each tool where one exists, providing examples of how the tools have been used. This makes the dashboard a more valuable resource for users seeking tested solutions.
More User-Friendly Experience The dashboard has been refined to feel cleaner and more intuitive, with improved layout organization, better spacing, and easier-to-use interactive elements. We’ve added more filters to help users customise their searches, and a way to easily clear selected filters. Visual clutter has been minimised while maintaining clear navigation, helping users quickly find what they need.
Altogether, these updates make the platform more powerful and more enjoyable to use.
Evolving with our users
These updates reflect our commitment to listening and responding to community feedback. Users told us they wanted easier navigation, more practical examples, and better organization – so we've redesigned the dashboard to address these needs. We've also recognised the importance of keeping pace with this rapidly evolving field, ensuring the platform stays current with the latest tool releases and updates. By continuously refining the dashboard based on user input and industry developments, we're building a resource that truly serves the community's needs.
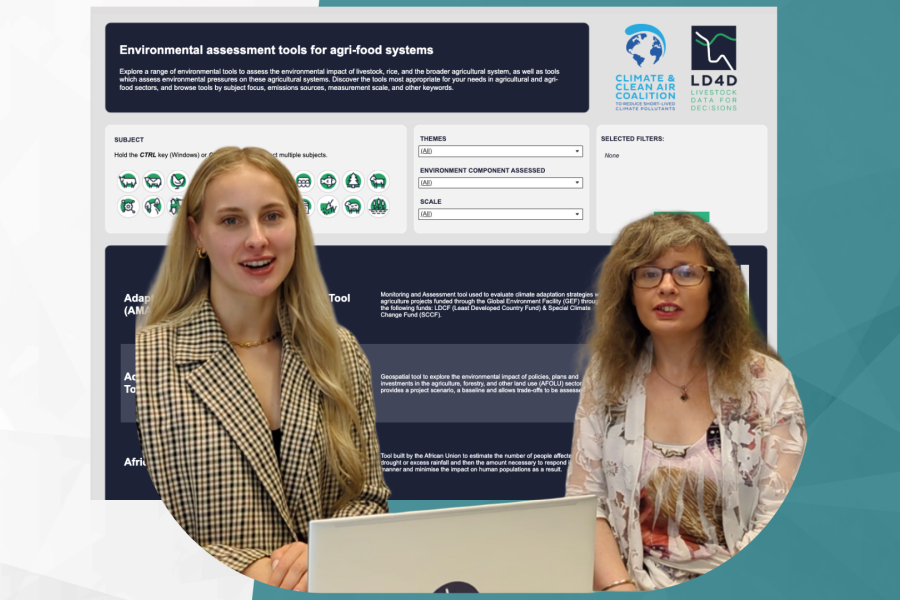
Demo for project managers
Data gaps
In compiling and reviewing the expanded tool library, researchers identified several gaps that persist despite the additions.
While the dashboard includes about 20 tools that are bespoke to livestock systems, including tools that reflect multiple parts of the agricultural sector, the majority of tools still only consider one part of the agricultural sector, and do not consider livestock at all. In addition, only a few tools incorporate social metrics – such as gender equality and social inclusion – alongside environmental criteria, making it difficult to assess how different activities impact on multiple Sustainable Development Goals (SDGs). This is particularly relevant to tools being used in LMICs, where agricultural systems are so intertwined with cultural and social aspects. Finally, most tools are still designed with high-income countries in mind, rather than low- and middle-income countries. This gap provides an opportunity to develop tools that are tailored to the specific needs of low-and middle-income countries, which is particularly important for seeking climate financing and for evaluating projects.
What's next?
The enhanced dashboard is designed to remain the go-to resource for policymakers, decision-makers, academics, and others interested in the environmental impact of agri-food systems. With the addition of real-world case studies, users can now see practical applications of these tools in action.
LD4D invites everyone across the livestock sector to use and contribute to the dashboard – including sharing additional case studies – to help it become a consolidated, practical collection of the best available tools for assessing environmental impact of agricultural systems.